Xdebug in VS Code for PHP
Xdebug is a PHP extension that provides debugging and profiling capabilities. This article shows how you can enable and use Xdebug in the VS Code editor.
Prerequisites
Before starting, ensure you have the following installed on your system:
PHP (7.4 or higher recommended)
Apache web server
VS Code editor
Node.js and npm (for VS Code extensions)
NVM (Node Version Manager, optional but recommended)
Official Documentation
Xdebug 3 Official Documentation: https://xdebug.org/docs/
Xdebug Installation Guide: https://xdebug.org/docs/install
Check Xdebug Installation Status
To check if Xdebug is installed and view its version, run the following command:
php -v
The output will display information about PHP and any installed extensions, including Xdebug.
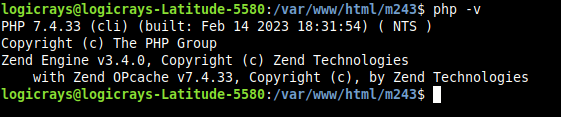
Fig. 7 PHP version output without Xdebug installed
Note
This screenshot was captured while testing Magento 2.4.3 with PHP 7.4.
Install Xdebug
Install Xdebug for your PHP version. For example, to install Xdebug for PHP 8.1:
sudo apt-get install php8.1-xdebug
Note
Replace php8.1 with your PHP version (e.g., php7.4, php8.0, php8.2, etc.).
After installation, restart the Apache web server:
sudo systemctl restart apache2
Verify the installation by running php -v again:
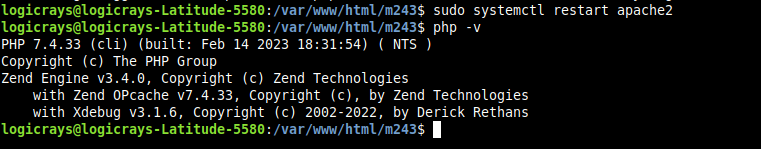
Fig. 8 PHP version output with Xdebug installed
Note
This screenshot was captured while debugging Magento 2.4.3 with PHP 7.4.
Install PHP Debug Extension in VS Code
Open the VS Code editor.
Install the
PHP Debugextension by Xdebug from the Extensions marketplace.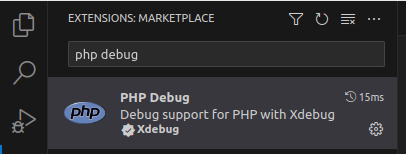
Fig. 9 PHP Debug extension in VS Code marketplace
Configure Xdebug
Follow these steps to configure Xdebug:
Create a file named
xdebuginfo.phpin your web root with the following content:<?php echo xdebug_info(); ?>
Access this file in your browser to find the Xdebug configuration file path.
Look for the Additional .ini files parsed section to find the path to
20-xdebug.ini.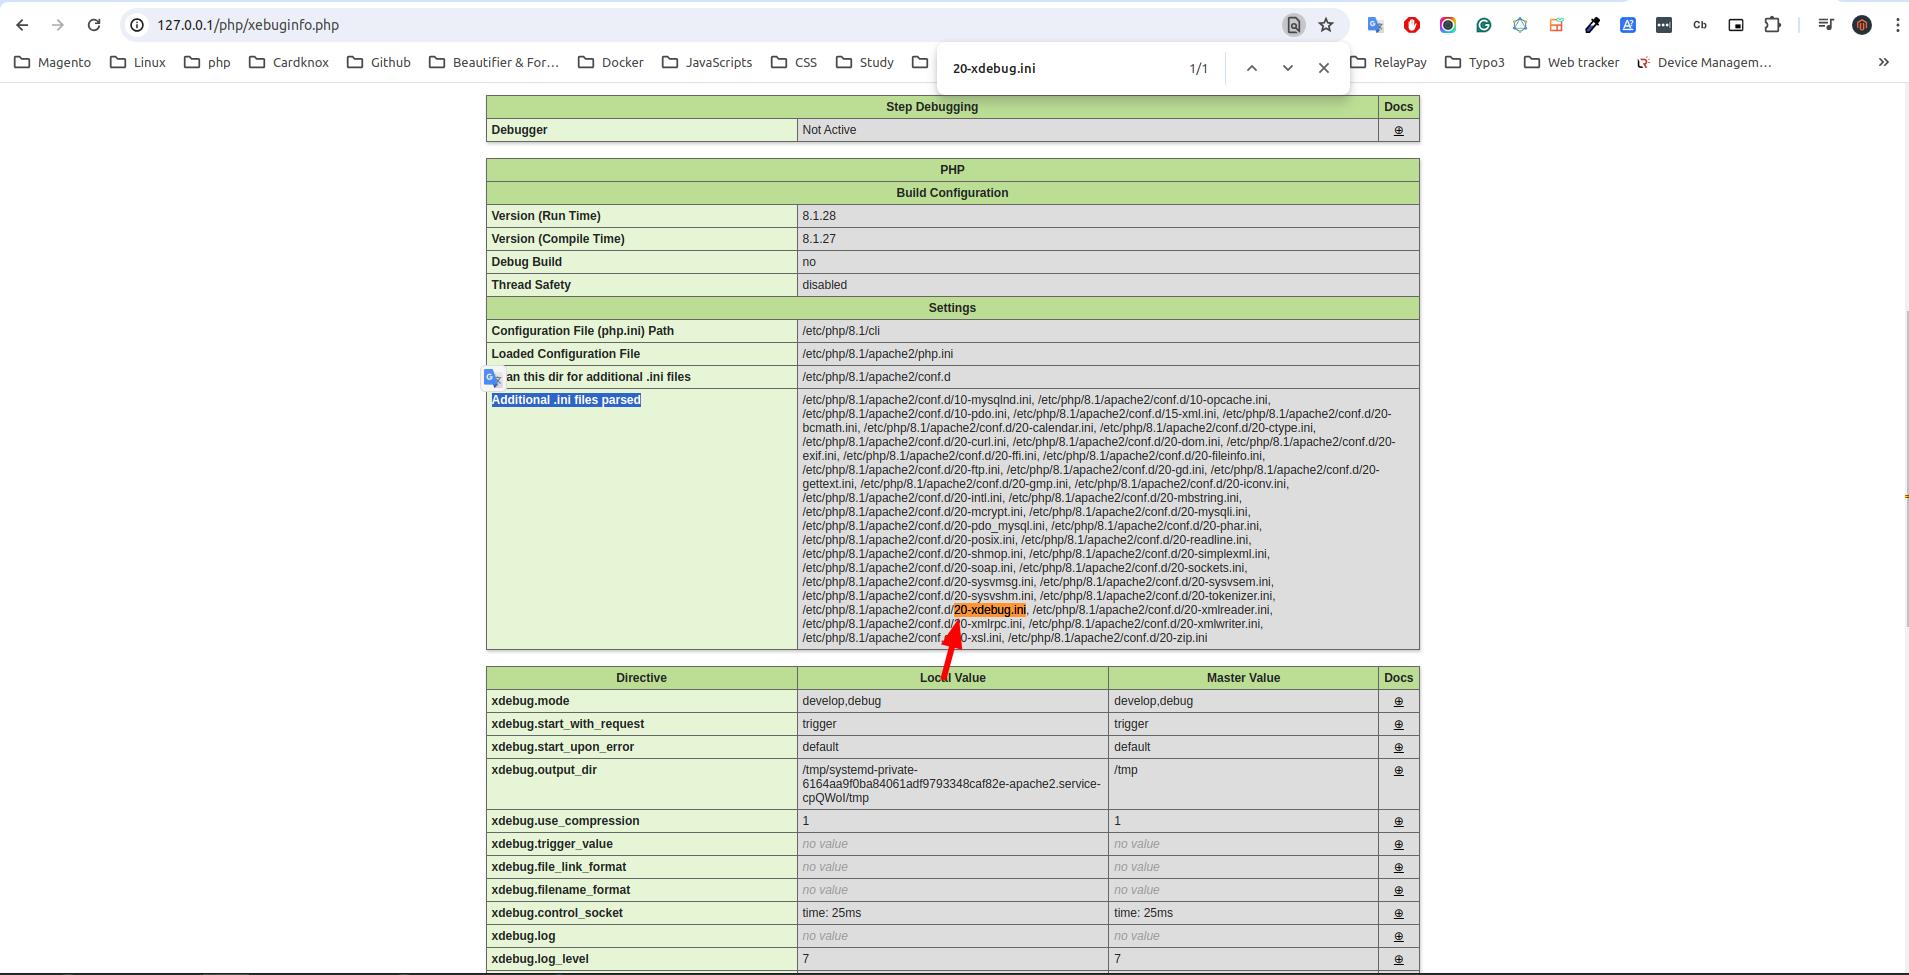
Fig. 10 Xdebug configuration file path
For PHP 8.1, open the file
/etc/php/8.1/apache2/conf.d/20-xdebug.iniand add the following configuration:zend_extension=xdebug.so xdebug.mode=develop,debug ; Use 'trigger' when debug is not needed, change to 'yes' when debugging xdebug.start_with_request = trigger
Note
Replace
8.1with your PHP version in the file path.Restart Apache to apply the changes:
sudo systemctl restart apache2
Create launch.json Configuration File
Open your project in VS Code.
Open the Debug view by clicking the
Debuggericon in the left sidebar or pressCtrl + Shift + D.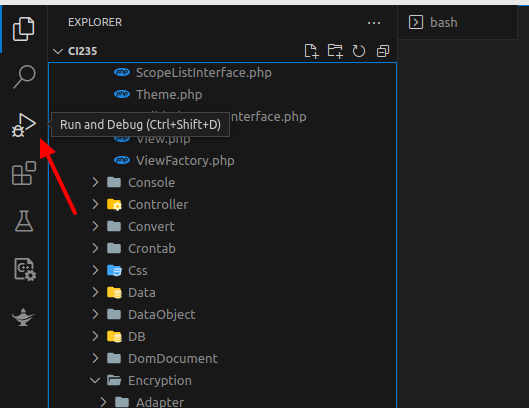
Fig. 11 VS Code Debug view
Click on
create a launch.json filelink.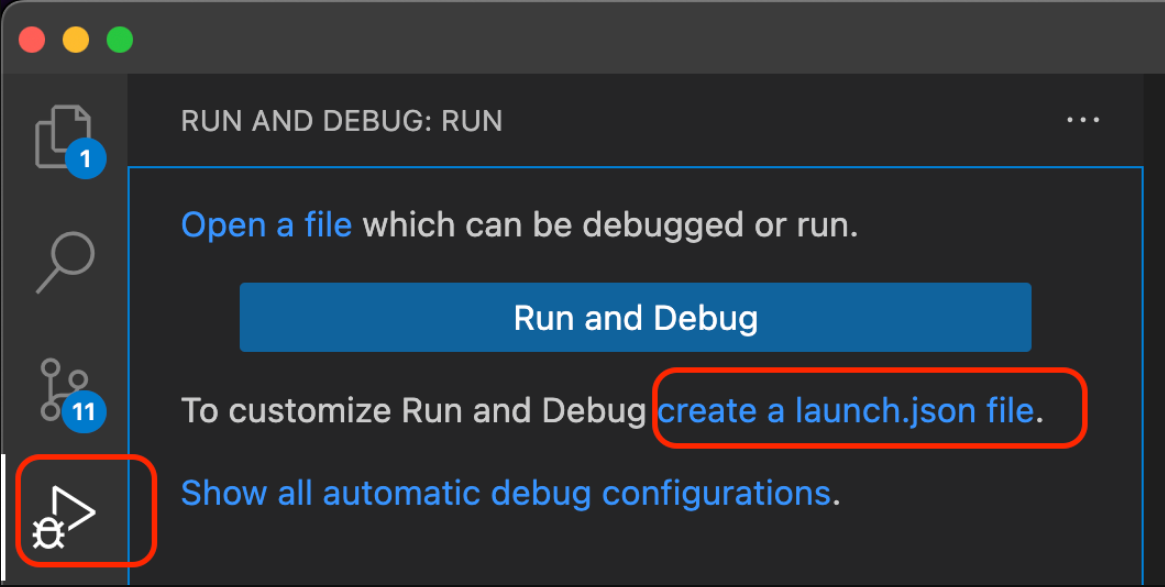
Fig. 12 Create launch.json file
Select
PHPas the environment from the popup menu.This will create a
.vscode/launch.jsonfile with default configuration. Add thepathMappingsproperty after"port": 9003in the configuration section:"pathMappings": { "/var/www/html/<your_project_directory_name>": "${workspaceFolder}" }
Important
Replace
<your_project_directory_name>with your actual project directory name on the server.
Understanding pathMappings
pathMappings is a critical configuration that maps server paths to local paths on your machine.
This mapping allows VS Code to correctly associate files on the server with files in your local workspace.
Without proper path mapping, breakpoints may not work correctly.
Example launch.json Configuration
Here’s a complete example of a launch.json file:
{
    "version": "0.2.0",
    "configurations": [
        {
            "name": "Listen for Xdebug",
            "type": "php",
            "request": "launch",
            "port": 9003,
            "pathMappings": {
                "/var/www/html/ci244p2": "${workspaceFolder}"
            }
        },
        {
            "name": "Launch currently open script",
            "type": "php",
            "request": "launch",
            "program": "${file}",
            "cwd": "${fileDirname}",
            "port": 0,
            "runtimeArgs": [
                "-dxdebug.start_with_request=yes"
            ],
            "env": {
                "XDEBUG_MODE": "debug,develop",
                "XDEBUG_CONFIG": "remote_port=${port}"
            }
        }
    ]
}
Note
If ${workspaceFolder} doesn’t work, use the absolute path to your project folder instead (e.g., /var/www/html/your-project).
Configuration complete! You’re now ready to start debugging.
Start/Stop Debugging in VS Code
Reference: https://blog.chapagain.com.np/enable-xdebug-in-vscode-for-php/
Example: Debugging Customer Login Process
Let’s walk through debugging a customer login process in Magento 2:
Open VS Code editor.
Open the file you want to debug. For example:
vendor/magento/module-customer/Controller/Account/LoginPost.php.Set a breakpoint by clicking in the left margin next to line 191 (or the line containing the authenticate method):
$customer = $this->customerAccountManagement->authenticate($login['username'], $login['password']);Start debugging by clicking the menu
Run > Start Debuggingor pressF5.Open your website in a browser and navigate to the customer login page (e.g.,
https://localhost/customer/account/login/).When the code execution reaches your breakpoint, VS Code will pause and display:
Variables in the Debug sidebar
Call stack
Watch expressions
Use the debug toolbar controls:
Continue (F5): Resume execution until the next breakpoint
Step Over (F10): Execute the current line and move to the next line
Step Into (F11): Step into functions called on the current line
Step Out (Shift+F11): Step out of the current function
Restart (Ctrl+Shift+F5): Restart the debugging session
Stop (Shift+F5): Stop debugging
Understanding Debug Controls
Step Into (F11)
When you reach a function call and click Step Into:
The debugger will enter the function and pause at the first line inside it.
You can see the line-by-line execution of the function.
After the function completes, the debugger returns to the line after the function call.
Use this when: You want to understand what’s happening inside a function.
Step Over (F10)
When you reach a function call and click Step Over:
The debugger executes the entire function without stopping inside it.
It immediately moves to the next line after the function call.
You cannot see the internal execution of the function.
Use this when: You trust the function works correctly and don’t need to debug it.
Step Out (Shift+F11)
When you’re inside a function and click Step Out:
The debugger completes the execution of the current function.
It returns to the calling function and pauses at the next line.
Useful when you’ve stepped into a function but want to quickly exit.
Use this when: You’ve stepped into a function but realize you don’t need to debug it further.
Additional Resources
Demo Video
Watch a practical demonstration: https://jumpshare.com/v/9n0Atl1NnLrLNrZWvGJw
YouTube Tutorials
- Xdebug 3: Setting up Apache, PHP, VS Code, and Xdebug in 10 minutes
https://www.youtube.com/watch?v=MmyxWy8jl7U&ab_channel=DerickRethans
Magento 2 Debugging Tricks - xDebug by Matheus Gontijo
Debug with
setDataandDataObject.phpmethods: https://youtu.be/eo8N7e9eEPIMySQL Query,fetchAll,fetchRow,Data Hydrate& PHP xDebug: https://youtu.be/xLf3OwpAFhQ
Tip
Practice using the debug controls on simple code first to get comfortable with the debugging workflow before tackling complex issues.